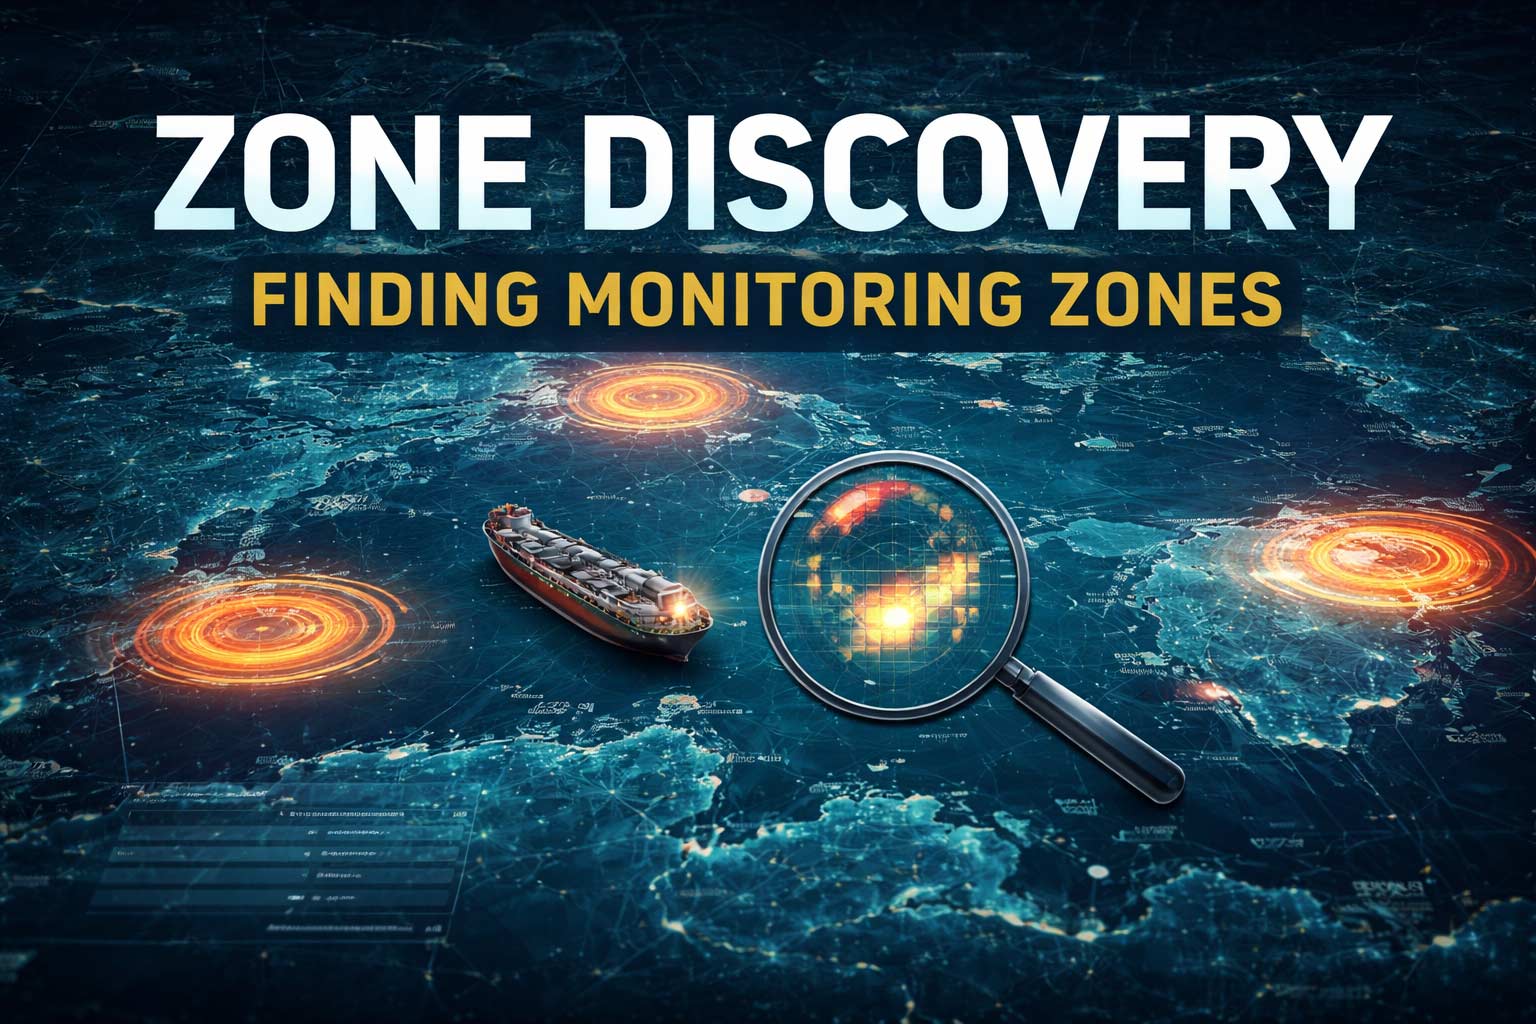
Extracting geographic patterns and sanctions evasion hotspots from vessel tracks to focus detection on high-signal waters.
FleetLeaks AIS Events is built to answer a simple question that turns out to be annoyingly expensive: Where should we be watching—so we’re not paying to ingest half the ocean just to find a handful of meaningful events?
Sanctions evasion doesn’t happen everywhere. It concentrates in specific waters where ships can loiter, go dark, or meet another tanker for a ship-to-ship transfer (STS). The hard part is that these hotspots shift as enforcement changes, and “watch everything” is not a strategy—it’s a budget fire.
So we built Zone Discovery: a method that uses sanctioned vessels’ own historical tracks to discover where suspicious behavior clusters, then turns those clusters into monitoring zones used by our real-time AIS ingestion and detection.
This post explains the “what” and “why” first (human-readable), then the method (technical), then how it plugs into the AIS Events system.
If you want to see the result immediately:
- Browse AIS Events
- Ust-Luga Events (Last 7 Days) — a high-signal example of a Russian export terminal zone
Sanctions Evasion Hotspots
We analyze historical track files for sanctioned vessels and extract “behavior points” (AIS gaps, dwell, loiter). Then we cluster those points geographically and score the clusters to identify probable evasion hotspots. Finally, we merge:
- Russian terminal / chokepoint zones (known infrastructure)
- OSINT-documented STS hotspots (published reporting / research)
- Discovered zones (algorithmic clusters from sanctioned-vessel behavior)
Those zones become the input to real-time monitoring and detection, so we ingest less noise and catch more signal.
One Example: Ust-Luga
Before the technical dive, here’s what this looks like in practice.
Ust-Luga is a major Russian oil export terminal on the Baltic Sea. It’s not an abstract hotspot—it’s infrastructure with repeat sanctioned-vessel behavior around it. When we run Zone Discovery on historical tracks, Ust-Luga lights up: dozens of distinct sanctioned IMOs, thousands of dwell hours, and a geographic footprint that matches the terminal approach and anchorage waters.
The algorithm didn’t know Ust-Luga existed. It found it by asking: where do sanctioned tankers consistently slow down, wait, and load?
That’s the whole idea. We’re not drawing boxes on a map and hoping; we’re letting sanctioned-vessel behavior tell us where the action is.
See it live: Ust-Luga Events (Last 7 Days)
The Problem We’re Solving
FleetLeaks runs real-time event detection (AIS gaps, zone dwell, loitering, STS candidates). That detection is only as good as where we’re looking.
If we define bounding boxes (“zones”) arbitrarily, we’ll get two failure modes:
- False comfort: “No STS events happened,” when actually we never watched the right water.
- Wasted ingestion: We watch busy, legitimate areas (port approaches, traffic lanes) and pay for a flood of irrelevant AIS positions we’ll later throw away.
Consider Athens or Rotterdam. Both generate enormous volumes of slow-moving, waiting, maneuvering vessel traffic. That’s not sanctions evasion—it’s congestion. If our zones are too broad or poorly placed, we’ll spend compute cycles flagging normal port operations while actual STS transfers happen in quieter waters we’re not watching.
So we need zones based on something real. Zone Discovery uses the strongest “ground truth” we already have: where sanctioned vessels actually go, and how they behave there.
How This Fits Into AIS Events
FleetLeaks AIS Events has two parts that matter here:
- Ingestion (AIS stream): We subscribe to AIS positions within defined bounding boxes.
- Detection: We run event logic primarily inside zones to keep compute manageable.
Zone Discovery improves both. Fewer, tighter zones means less ingestion volume. Better-placed zones means more relevant events per dollar and per CPU cycle.
The feedback loop is continuous: zones define where we ingest, detectors generate events inside those zones, and analyst review highlights which zones are producing signal versus noise. Zone Discovery runs periodically to refresh the map based on new behavioral data.
Inputs
1) Sanctioned Vessel Track Histories
We keep JSON history files per vessel (named by IMO) containing timestamped positions (lat/lon/speed/time). Zone Discovery processes all available files and extracts suspicious behavior signals from them.
2) OSINT Hotspots (Published Reporting)
Some zones are known because journalists and analysts have already done the painful work of reporting, investigation, and cross-referencing. For example, Reuters has reported on how Russia’s shadow fleet adapts to enforcement pressure, including shifting STS activity patterns in response to naval patrols and policy changes.
These OSINT-confirmed zones get Tier A status by default—we’re not going to second-guess published investigative work with an algorithm.
3) Russia Export Terminals and Chokepoints
Terminals and chokepoints aren’t “suspicion”—they’re infrastructure reality. Oil and LNG have to leave somewhere, and traffic concentrates around those exit points. Primorsk, Ust-Luga, Novorossiysk, Kozmino—these stay Tier A because they’re where Russian energy exports physically load onto tankers.
4) Major Ports List (Noise Filter)
Busy ports generate behavior points (slow speed, waiting, congestion) that look suspicious to a naive algorithm. We maintain a “major ports” list so we can penalize or exclude clusters that are likely just commercial traffic rather than evasion activity.
Behavior Extraction: Turning Tracks Into “Suspicious Points”
From raw positions, we extract three behavior types. These are breadcrumbs that tend to appear near evasion or concealment tactics—not proof of wrongdoing, but patterns worth clustering.
The logic is simple: if you wanted to transfer cargo covertly, load Russian oil, or avoid detection, you’d probably need to slow down, wait somewhere, and maybe go dark for a while. Those behaviors leave traces in AIS data.
AIS Gaps
When a vessel stops transmitting for a threshold duration (example: 6+ hours). We capture the last position before the gap and first position after. Gaps can be innocent (coverage issues, equipment failure). They can also be deliberate. The point is: gaps are worth clustering.
Dwell Episodes
Prolonged very low speed (example: ≤ 0.5 knots for 4+ hours). This often corresponds to loading/waiting at terminals, offshore holding patterns, or transfer setup behavior.
Loiter Patterns
Low speed, confined area movement (example: ≤ 3 knots for 2+ hours). This frequently shows up near offshore anchorages, STS rendezvous areas, and chokepoint waiting zones.
These thresholds are tunable defaults. The method matters more than the exact numbers.
Clustering: Where Does Suspicious Behavior Concentrate?
A single sanctioned vessel drifting somewhere is not a “hotspot.” Thirty sanctioned vessels doing the same thing in the same waters is.
We use DBSCAN (Density-Based Spatial Clustering of Applications with Noise)—a clustering algorithm that finds dense regions of points without requiring us to pre-specify how many clusters exist. In plain terms: we dump all the behavior points on a map and ask the algorithm to find the piles. Dense piles become candidate zones; scattered noise gets ignored.
Each cluster yields a centroid (for labeling/visualization), a bounding box (for monitoring/ingestion), and stats (vessel count, dwell hours, gap count, night fraction, etc.).
The key insight is that we’re clustering behavior from sanctioned vessels specifically. That’s our ground truth. If many sanctioned tankers independently exhibit suspicious behavior in the same waters, that’s a signal worth monitoring—even if we don‘t yet know why that spot matters.
Scoring: Separating “Busy” From “Sketchy”
Not all clusters are equal. A port approach and a covert STS anchorage can both generate slow speed points. So each cluster gets a 0–100 evasion score based on indicators that tend to correlate with sanctions-evasion tradecraft:
Positive signals:
- More distinct sanctioned vessels → established pattern
- More cumulative dwell time → “this isn’t just passing through”
- More AIS gaps starting/ending in the zone → potential concealment
- Higher night activity fraction → darkness as cover
Negative signals:
- Proximity to major commercial port → likely congestion, not evasion
The result is a ranked list of clusters, where the highest-scoring ones are the best candidates for monitoring zones. A cluster near Rotterdam with 50 vessels but high port-proximity penalty scores lower than a remote anchorage with 15 vessels and high gap/night activity.
Tiering: Core vs Scout Zones
Zones are expensive because they drive ingestion volume. So we don‘t treat all discoveries equally.
Tier A — Core Monitoring
Always monitored. Includes:
- Russian export terminals and key chokepoints
- OSINT-confirmed STS hotspots
- High-confidence discovered clusters (score ≥ threshold + enough vessels)
Tier B — Scout Zones
Trial monitoring (example: 14–30 days). Zones can be promoted to Tier A if they generate sustained events across multiple vessels, or dropped if they produce no meaningful activity after the trial period.
This prevents the system from turning into “monitor everything forever.” Zones have to earn their keep.
Validation: Did the Algorithm Rediscover Reality?
This is the sanity check: if we run discovery “blind,” does it find places we already know matter?
In early runs, the method independently surfaced clusters consistent with known export terminals (Ust-Luga, Primorsk, Novorossiysk) and documented STS regions—without being told those places existed. That matters because it tells us we’re not just inventing geometry; we’re extracting signal from behavior.
When the algorithm rediscovers a Reuters-reported STS hotspot or a terminal we added from infrastructure data, that’s confirmation the behavioral approach works.
Using the Map
Below is the hotspot visualization. Color reflects evasion score; size reflects the scale of participation (vessel count / activity level). Click a hotspot to inspect its stats and then pivot into live events.
Click a hotspot → see its zone ID and stats → open it in the AIS Events filters to view live detections.
What This Does NOT Do
Zone Discovery is a focusing tool, not a verdict machine. Some honest limitations:
- Doesn’t prove illicit transfers. A zone with high activity is a place worth watching, not evidence of a crime.
- Doesn’t see permanently dark ships. If a vessel disables AIS and never reappears in our data, there’s no behavior to cluster.
- Doesn’t perfectly separate port congestion from evasion. The port-proximity penalty is a heuristic, not a guarantee. OSINT confirmation is the override mechanism.
- Doesn’t account for temporal shifts automatically. Enforcement pressure moves evasion patterns. Discovery must be rerun periodically, not treated as a one-time map.
These limitations are why Zone Discovery feeds a detection system with human review—not a fully automated accusation pipeline.
How This Feeds the Live Events System
Once zones are generated (OSINT + Russia + Discovered), they get synced into WordPress and consumed by the ingest daemon on startup.
At runtime, the loop looks like this:
- Zones define where we ingest AIS positions
- Detectors generate events inside those zones
- Weekly briefs and analyst feedback highlight high-yield zones, dead zones, and emerging zones worth scouting
- Zone Discovery runs again on demand (and periodically) to refresh the map
That’s the whole point: a feedback loop, not a one-time guess.
Further Reading
A few external references on the broader context:
- Reuters: How Russia’s shadow fleet stays one step ahead of Western sanctions — reporting on adaptive STS dynamics and enforcement effects
- AP: Russia’s shadow fleet — overview of the shadow fleet model keeping Russian oil moving
- USNI Proceedings: Red Flags — tradecraft framing for maritime sanctions evasion
Methodology Documentation
This Zone Discovery write-up is part of the broader AIS Events methodology. The technical spec, thresholds, and changelog belong there so the system remains inspectable and versioned over time.
FleetLeaks tracks sanctioned vessels to support compliance, research, and investigative work. Zone Discovery exists for one reason: focus monitoring on waters where evasion is likely, without wasting ingestion budget on the rest of the planet.