FleetLeaks now includes a dedicated section for tracking Russian oil export terminals. This addition complements the existing vessel sanctions database by providing infrastructure-level intelligence across Russia’s maritime export network.
What We Added
The terminals section catalogs Russian oil and gas export infrastructure across five maritime regions: the Baltic Sea, Black Sea and Sea of Azov, Barents Sea and Arctic, Far East and Pacific, and the Caspian Sea. Each terminal entry includes geographic coordinates, operational capacity data, ownership information, commodity types handled, and—where available—live traffic analytics derived from AIS vessel tracking data.
The database covers the full spectrum of Russian export infrastructure, from major export hubs like Primorsk (67 million tonnes per year crude capacity) and Kozmino (serving Pacific markets) down to smaller seasonal facilities and Single Point Moorings. Terminals are categorized by their role in Russia’s export network: Major Export Hubs that handle the bulk of crude and product flows, Regional and Secondary Ports that serve specific markets or provide operational flexibility, and Local or Seasonal facilities that operate intermittently or serve niche functions.
Database Structure and Navigation
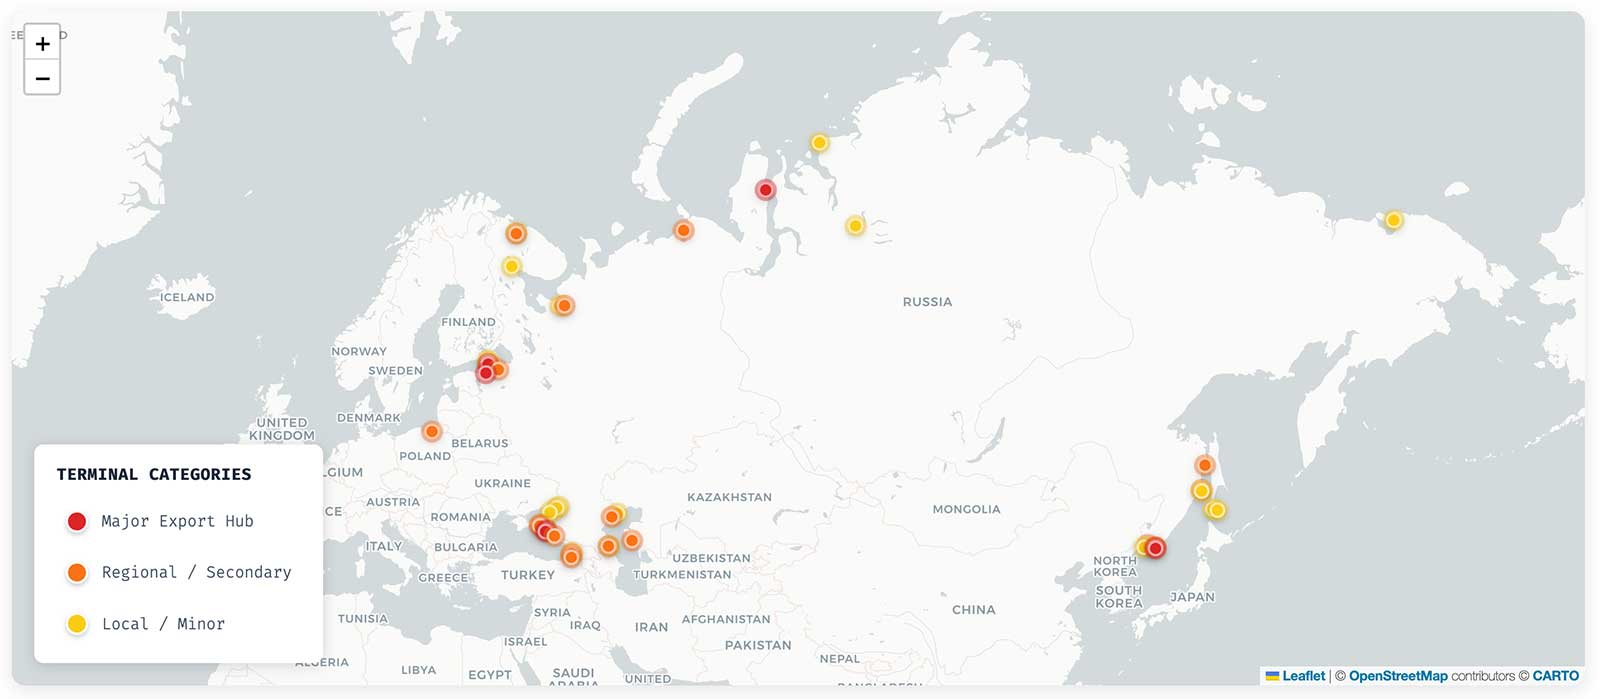
The main terminals page presents an interactive map built on Leaflet.js, with terminals plotted by their actual geographic coordinates. Color-coded markers distinguish between facility categories, allowing users to quickly identify major infrastructure versus smaller operations. The map supports standard pan and zoom controls, and clicking any marker opens a popup with basic terminal information and a link to the full profile.
Below the map, a sortable table lists all terminals with key attributes: trading name, terminal type (crude, refined products, LNG, multi-purpose), primary operator, geographic area, annual throughput capacity, and current operational status. Users can filter this list by category, area, commodity type, and status to narrow results to specific criteria.
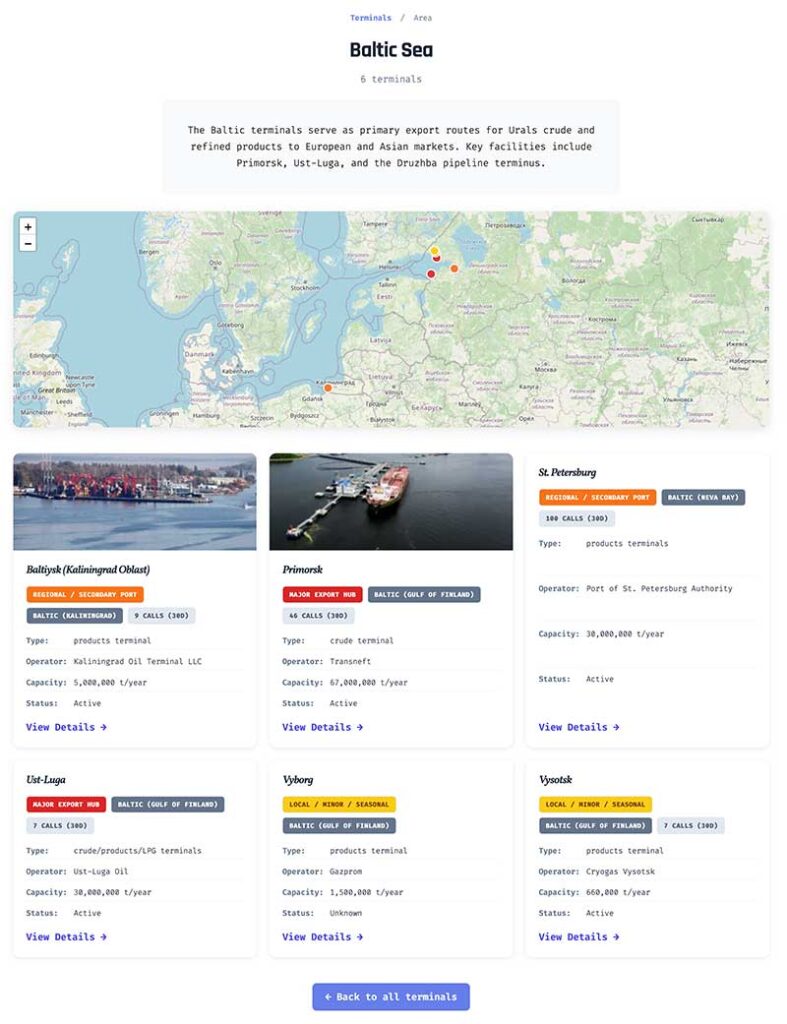
Geographic filtering deserves particular mention. The terminal_area taxonomy organizes facilities hierarchically—parent terms represent major maritime basins (Baltic Sea, Black Sea, etc.), while child terms capture sub-regions like the Gulf of Finland or Sea of Azov. Filtering by a parent area automatically includes all terminals in child regions. Each area has its own dedicated page showing a regional map, description of that basin’s strategic importance, and cards for all terminals within it.
Individual Terminal Profiles
Clicking through to any terminal opens a detailed profile page. The layout mirrors the imo-9236743/”>imo-imo-9236743/”>9236743/” target=”_blank” rel=”noreferrer noopener”>vessel profile design for consistency across the platform. Each profile contains several distinct sections:
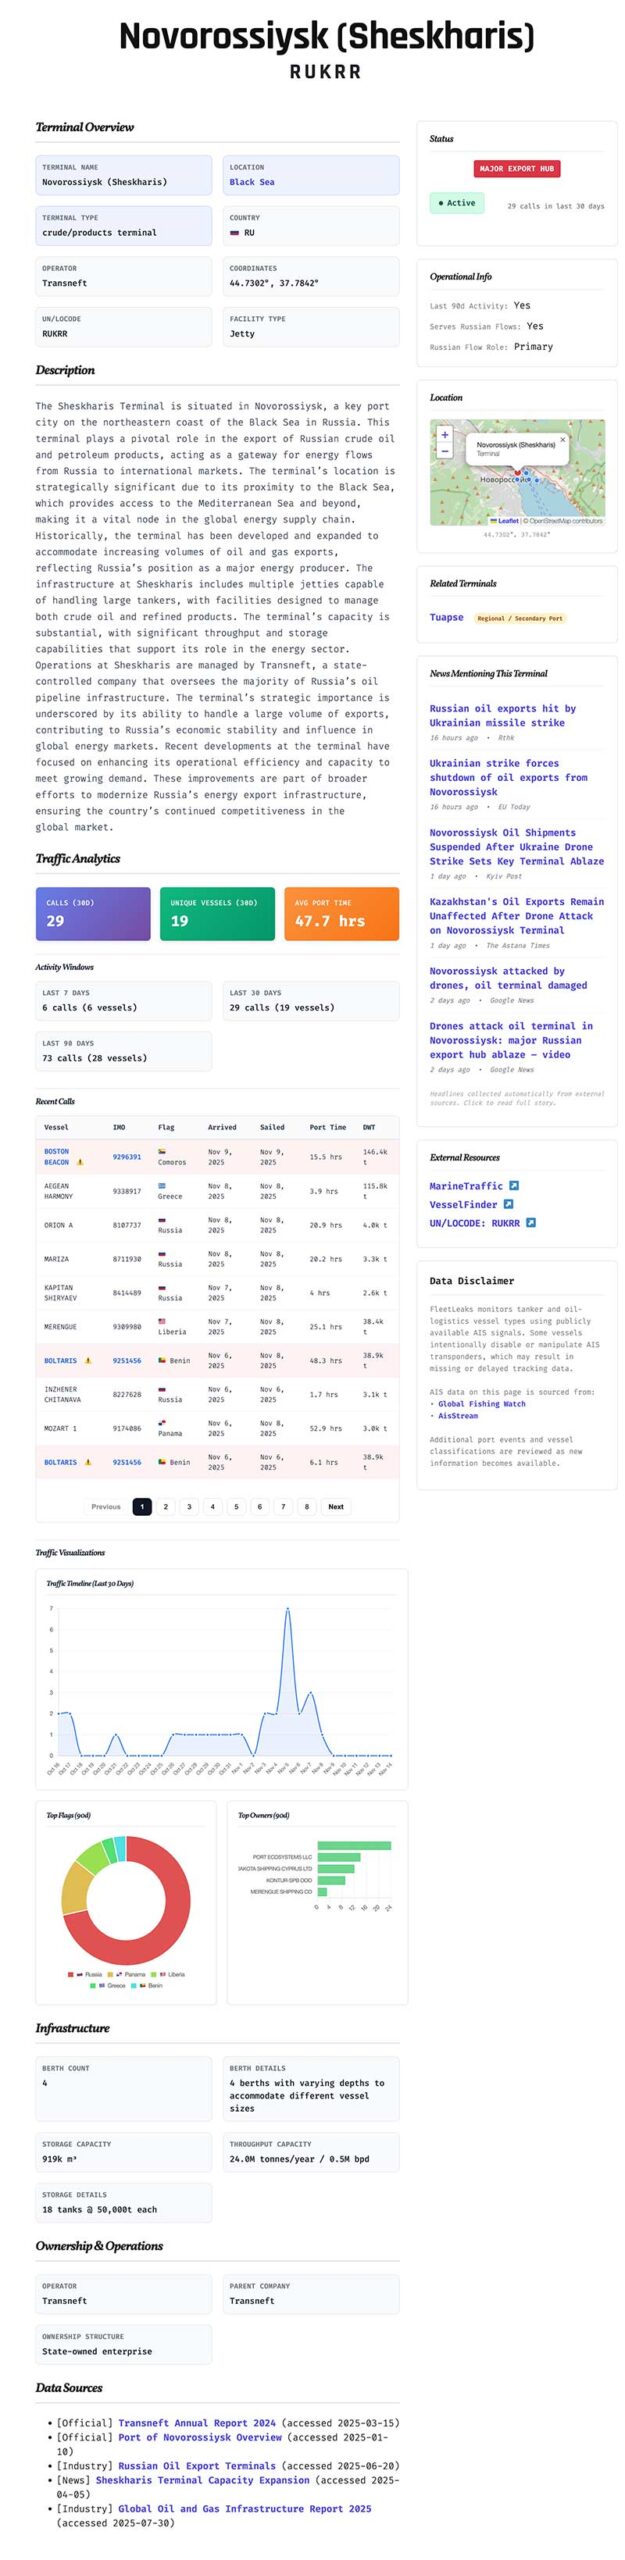
Terminal Overview provides the basic identification: official name, alternate names or transliterations, UN/LOCODE where applicable, geographic coordinates, and the maritime basin it serves. This section also displays the terminal type and operational category.
Infrastructure Specifications documents the physical capabilities: number of berths, maximum vessel size (DWT), storage capacity in cubic meters, and annual throughput capacity expressed in both tonnes per year and barrels per day. For terminals with seasonal ice restrictions, the typical ice window is noted.
Ownership and Operations identifies the operating company (Transneft, Rosneft, Gazprom Neft, regional port authorities, etc.), parent company relationships, and ownership structure details where publicly available. This information is critical for understanding corporate exposure to sanctions risk.
Traffic Analytics presents AIS-derived data on terminal activity. Where we have sufficient vessel tracking data, this section shows total vessel calls over 7-day, 30-day, and 90-day windows, unique vessel counts, estimated loaded tonnage, and average port time. These metrics update as our AIS collection pipeline processes new position data.
Recent Vessel Calls provides a paginated table of individual port calls, showing vessel name, IMO number, flag state, arrival and departure times, and—importantly—whether that vessel appears in our sanctions database. When a sanctioned vessel is detected in the call history, the entry links directly to that vessel’s profile where users can see which jurisdictions have designated it.
Operational Status is computed automatically based on AIS activity patterns. Terminals showing vessel traffic within the last 30 days are marked Active. Those with traffic in the 30-90 day window but nothing recent show as Inactive. Facilities with no recorded traffic beyond 90 days are marked Suspended. Terminals in Arctic regions with documented ice seasons may show as Seasonal during winter months. This automated status computation removes guesswork about whether a facility is currently operational.
News Aggregation pulls recent articles mentioning the terminal from Google News and News Data. This provides context on operational changes, incidents, maintenance, or sanctions-related developments specific to that facility.
Data Sources lists the references used to compile the terminal’s information, with access dates and source types (official port authority data, industry reports, news articles, AIS data). This attribution is essential for users who need to verify information against primary sources.
How This Connects to Vessel Tracking
The terminals database integrates with the existing vessel sanctions tracking in several ways. When viewing a terminal’s recent calls, any vessel that appears in our sanctions database is flagged with its sanctioning jurisdictions. This creates a direct link between infrastructure and the vessels using it.
Conversely, when analyzing a specific sanctioned vessel’s activity patterns, users can cross-reference its port calls against the terminal database to understand which Russian export facilities it has serviced. This bidirectional relationship between vessels and infrastructure provides a more complete picture of how sanctioned tonnage moves through the supply chain.
The system also tracks sanctioned vessel visits as an aggregate metric per terminal. A terminal showing frequent calls from designated vessels may warrant closer scrutiny from compliance teams, even if the terminal itself is not subject to sanctions.
Target Audiences and Use Cases
Maritime Compliance Officers at shipping companies face the challenge of ensuring their vessels don‘t inadvertently support sanctions evasion. Before chartering a vessel, compliance teams can check whether it has recently called at terminals known to load Russian crude or products. If a vessel shows repeated calls at Kozmino or Ust-Luga, that history factors into the risk assessment for any future charter. The terminal database provides the infrastructure context that vessel-only tracking lacks.
A practical example: A shipping company is offered a time charter for a Suezmax tanker. The vessel isn’t sanctioned, but its recent AIS history shows multiple loadings at Novorossiysk’s Sheskharis terminal. The compliance officer can review that terminal’s profile, see it handles Russian crude and Kazakh CPC blend, note which sanctioned vessels have also called there, and make an informed decision about the reputational and compliance risk of putting their cargo on that vessel.
Financial Institutions and Trade Finance Teams need to understand exposure when financing commodity trades. A bank considering a letter of credit for an oil cargo needs to assess whether the transaction might involve Russian-origin product, even if it’s transshipped or blended. By knowing which terminals handle what commodities and understanding their throughput patterns, trade finance teams can better evaluate whether a proposed transaction raises red flags.
For instance: A commodity trader requests financing for a fuel oil cargo loaded at Ventspils, Latvia. The bank’s compliance team checks FleetLeaks and sees that while Ventspils is not a Russian terminal, certain vessels calling there have also called at Russian facilities. This doesn’t automatically disqualify the transaction, but it prompts additional due diligence questions about cargo origin and chain of custody.
Insurance Underwriters and P&I Clubs must assess risk when covering vessels trading in sanctioned regions. Understanding which Russian terminals remain active, their throughput volumes, and the types of vessels calling there helps underwriters price risk appropriately. A vessel frequently trading between Russian terminals and known transshipment points presents different risk characteristics than one with no Russian exposure.
Consider an underwriter reviewing a hull and machinery policy renewal. The vessel’s trading pattern shows regular calls at Primorsk and Murmansk. The underwriter can review these terminals’ profiles, see operational status, note the prevalence of older tonnage in call histories (potential maintenance risk), and assess whether the premium adequately reflects the operational profile.
Investigative Journalists and Researchers tracking sanctions enforcement or Russian oil flows need verifiable data points. Each terminal profile includes source attribution, allowing journalists to cite specific capacity figures or ownership details with confidence. The AIS-derived traffic data provides quantitative evidence of operational patterns that can support investigative reporting.
A journalist investigating whether Russian crude exports have actually declined post-sanctions can examine terminal-level throughput estimates over time. If Kozmino‘s traffic analytics show steady vessel calls while official export statistics claim reductions, that discrepancy becomes a story worth investigating further.
Government Analysts and Regulatory Bodies monitoring sanctions effectiveness benefit from having infrastructure data aggregated in one place. Rather than assembling terminal information from disparate sources, analysts can review the entire Russian export network systematically. The geographic organization by basin helps identify regional patterns—for instance, whether Arctic terminals are gaining traffic as Baltic routes face restrictions.
Legal Professionals handling sanctions compliance or enforcement cases need to understand the physical infrastructure involved in alleged violations. When a case involves a vessel that loaded at a specific Russian terminal, attorneys can reference that terminal’s profile for capacity data, typical cargo types, and operational characteristics. This technical detail strengthens legal arguments by grounding them in verifiable infrastructure facts.
Data Methodology and Limitations
Terminal information is compiled from multiple sources: official port authority publications, industry reports from maritime intelligence providers, academic research on Russian energy infrastructure, and government publications. Where sources conflict, we prioritize official data and note discrepancies.
Capacity figures should be understood as nameplate or designed capacity, not necessarily current operational throughput. Actual utilization varies based on maintenance, seasonal factors, demand, and sanctions pressure. The throughput numbers provide a baseline for understanding each terminal’s potential role in Russian exports.
AIS-derived traffic analytics depend on our vessel tracking coverage. Major export hubs with high traffic volumes generate robust statistics. Smaller or more remote terminals may have gaps in coverage, particularly in the Arctic or Caspian regions where AIS reception is limited. We continuously work to improve coverage, but users should treat traffic data as indicative rather than exhaustive.
Operational status is inferred from AIS patterns, not official announcements. A terminal showing as “Inactive” may still be operational but experiencing a lull in vessel traffic, or our AIS coverage may have missed recent calls. Similarly, “Active” status means we’ve detected vessel traffic, not that the terminal is operating at full capacity.
The database focuses on export terminals handling crude oil, refined petroleum products, and LNG. It does not currently cover import facilities, dry bulk terminals, or container ports, though these may be added in future expansions.
Accessing the Terminal Database
The terminals section is accessible from the main navigation menu. Users can browse the complete list, filter by various criteria, explore the interactive map, or navigate directly to specific terminal profiles. Each area taxonomy page provides a focused view of terminals within that maritime region, including a description of the basin’s strategic importance and a regional map.
No registration or account is required to access terminal information. The database is publicly available as part of FleetLeaks’ mission to provide transparent sanctions intelligence. API access for programmatic queries follows the same REST endpoints used for vessel data, documented in the API section.
Future Development
The terminal database will continue to expand as we document additional facilities and enhance existing profiles. Planned improvements include historical traffic trend visualization, more granular cargo grade tracking where data permits, and improved integration with the vessel tracking timeline to show port call sequences.
We welcome corrections or additions from users with specialized knowledge of Russian oil and gas infrastructure. Submit updates through the contact form with supporting sources, and we’ll review for inclusion.
The terminals section represents a significant expansion of FleetLeaks’ coverage, extending sanctions intelligence from vessels to the infrastructure they service. By understanding both the ships and the ports, users gain a more complete picture of how Russian energy exports move through global supply chains.